Insolvency Statistics in the UK (Bankruptcy, IVA, DRO)
For free & impartial money advice you can visit MoneyHelper. We work with The Debt Advice Service who provide information about your options. This isn’t a full fact-find, some debt solutions may not be suitable in all circumstances, ongoing fees might apply & your credit rating may be affected.
For free & impartial money advice you can visit MoneyHelper. We work with The Debt Advice Service who provide information about your options. This isn’t a full fact-find, some debt solutions may not be suitable in all circumstances, ongoing fees might apply & your credit rating may be affected.
Are you curious about how many people in the UK face bankruptcy? You’ve come to the right place. This article will help you understand the numbers and reasons behind insolvency in the UK, which includes bankruptcy, Individual Voluntary Arrangements (IVA), and Debt Relief Orders (DRO).
It’s natural to worry when you hear about rising insolvency rates, but you’re not alone. Each month, over 170,000 people visit our website to understand these tricky matters.
In this article, we’ll explain:
- What insolvency means and how it differs from bankruptcy
- The latest statistics on insolvency in the UK
- How gender and age play a role in insolvency
- The common reasons why people become insolvent
- Possible solutions if you are facing insolvency
Our team is well-versed in these issues, and some of us have even faced similar situations. We understand how you feel and are here to help.
Let’s dive in.
Insolvency statistics
- In 2021, the rate of individual insolvencies grew from January to April by 3.2% compared to the same period in the previous year.
- 575 bankruptcies were registered in January 2022, which was 32% lower than in January 2021 and 63% lower than in January 2020.
- Someone declares insolvency every 5 minutes. In the United Kingdom, the average debt has risen to the point that 280 people are declared bankrupt or insolvent per day. Every 5 minutes, someone is found unable to pay!
- For the fourth consecutive year, the total insolvency rate grew to 26.1 per 10,000 adults, an increase of 1.4 per 10,000. Individual voluntary arrangements (IVAs) remained the primary method of resolving individual insolvencies.
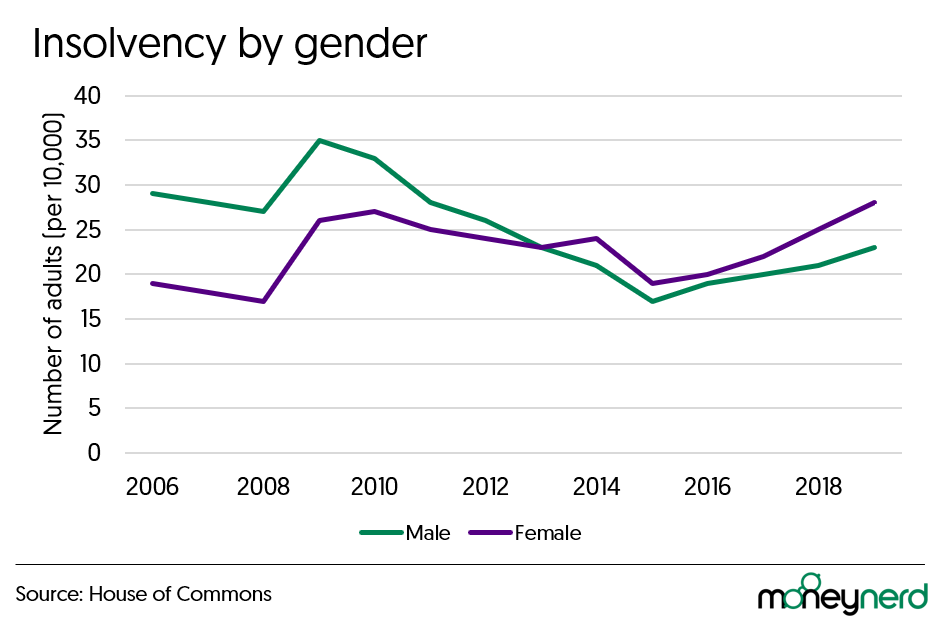
Insolvencies by gender in the UK
In 2019, the female insolvency rate was 27.8 per 10,000 adults, while the male insolvency rate was 24.1. This results in a gender disparity of 3.8, up from 3.2 the previous year.
Historically, men have had a greater rate of insolvencies per 10,000 individuals than women, but the gender divide began to close significantly in 2009, and by 2014, women had begun to exceed men in terms of insolvency rates.
This shift occurred in tandem with a drop in bankruptcies (where males have a greater rate of insolvency), the introduction and rise of DROs (where women have a higher rate of insolvency), and the narrowing and eventual reversal of the gender divide in IVAs.
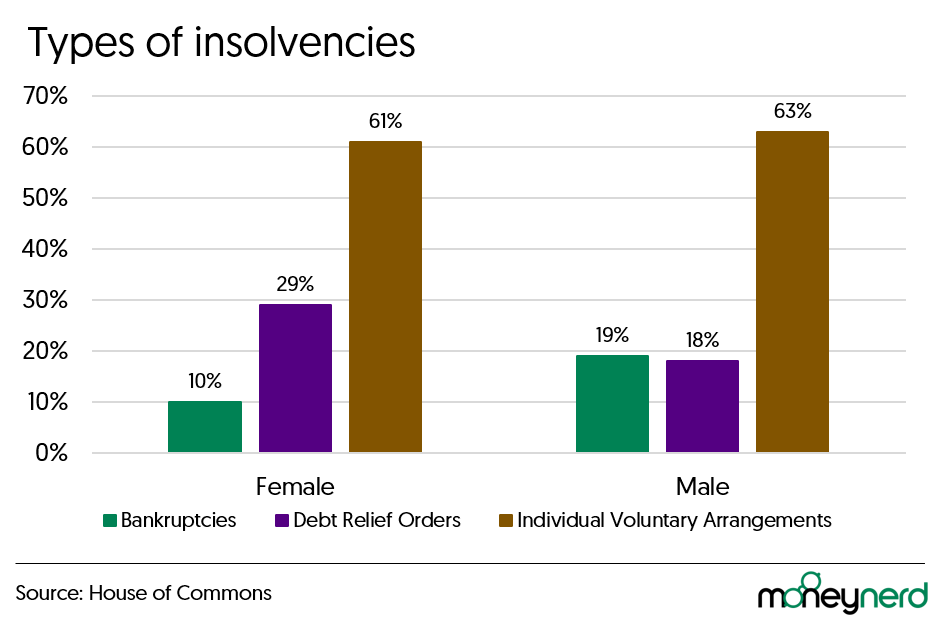
IVAs were the most common type of bankruptcy for both men and women (66% for males, 63% for females).
The relative proportions of DROs and bankruptcies, on the other hand, differed by gender. DROs accounted for 27% of female insolvencies and 17% of male insolvencies.
Bankruptcies, on the other hand, are the polar opposite, accounting for 10% of female insolvencies and 18% of male insolvencies.
Someone declares insolvency every 5 minutes. In the United Kingdom, the average debt has risen to the point that 280 people are declared bankrupt or insolvent per day. Every 5 minutes, someone is found unable to pay!
In every district of England and Wales, females had a higher rate of insolvency than males.
The highest gender disparity was found in the North East (a difference of 6.9 insolvencies per 10,000 adults).
In comparison, the smallest disparity was found in London (0.6 insolvencies per 10,000 adults), despite their higher and lower rates, respectively. Additionally, the disparity has expanded in the North East but shrunk in London.
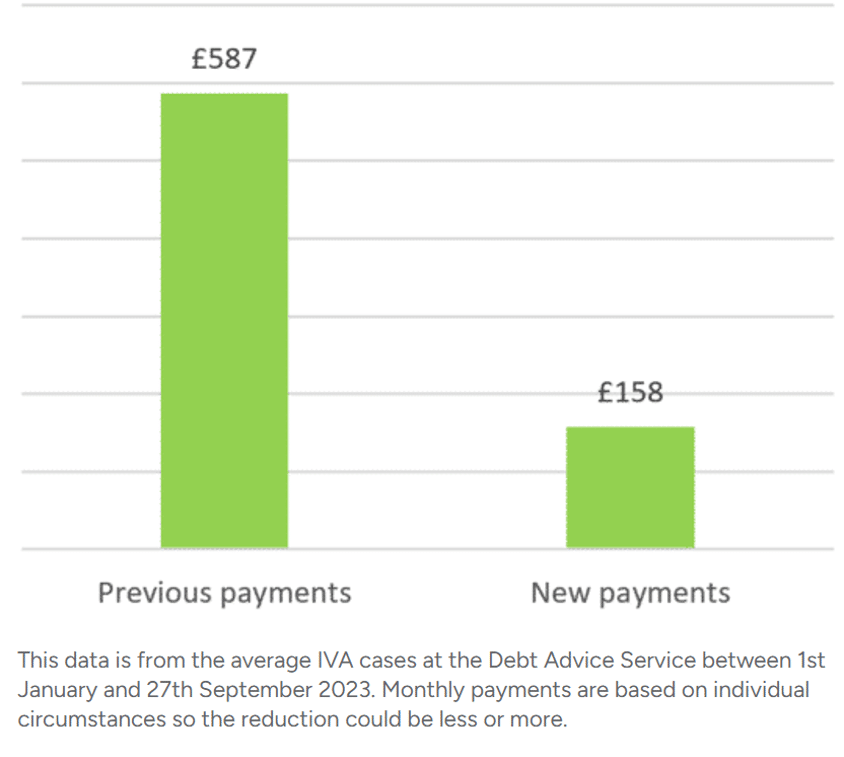
How a debt solution could help
Some debt solutions can:
- Stop nasty calls from creditors
- Freeze interest and charges
- Reduce your monthly payments
A few debt solutions can even result in writing off some of your debt.
Here’s an example:
Situation
| Monthly income | £2,504 |
| Monthly expenses | £2,345 |
| Total debt | £32,049 |
Monthly debt repayments
| Before | £587 |
| After | £158 |
£429 reduction in monthly payments
If you want to learn what debt solutions are available to you, click the button below to get started.
Average insolvency by age in the UK
Insolvency rates by age distribution remained roughly comparable from 2019 to 2018.
Insolvency rates are lower among younger adults, peak in middle age, and then fall again among older adults in 2019.
Since 2006, this pattern has been consistent.
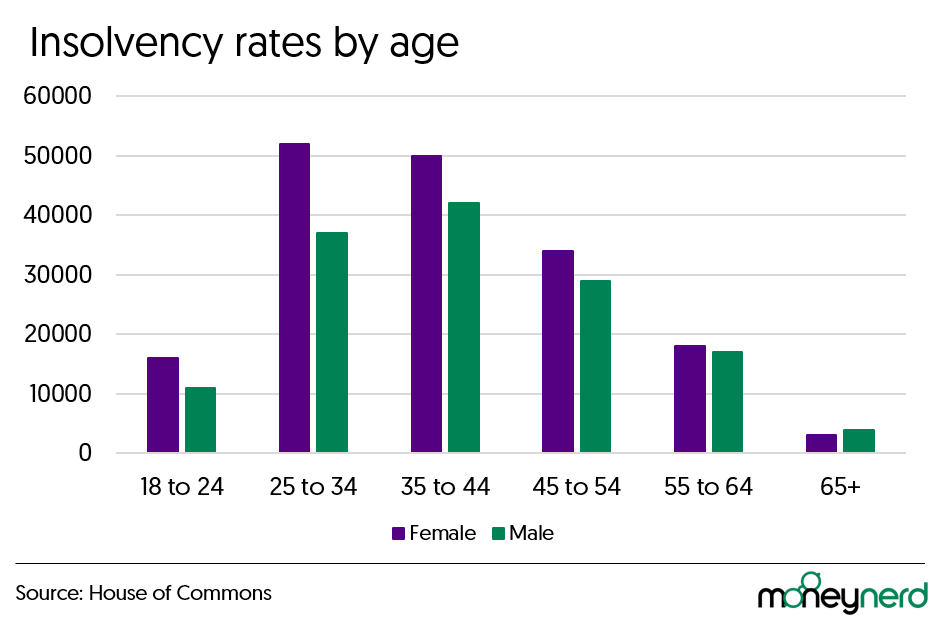
Females under the age of 65 had a higher rate of insolvency than males of the same age. For individuals aged 65 and over, the reverse was true. In 2018, the same trend was also found.
Additionally, the insolvency rate climbed across all age categories in 2019 compared to 2018, with the exception of the over 65s, who saw a minor reduction.
The age group of 35 to 44 years old had the greatest increase in rates (an increase of 3.6 per 10,000 adults). Those under the age of 45 account for the majority of the increase in insolvency rates, whereas older adults see less change in their rates.
IVAs were the most prevalent type of insolvency across all age categories, but their prevalence varied significantly.
The proportion of insolvencies that are IVAs tends to increase with age, whereas the proportion of bankruptcies tends to decrease with age.
For the fourth consecutive year, the total insolvency rate grew to 26.1 per 10,000 adults, an increase of 1.4 per 10,000. Individual voluntary arrangements (IVAs) remained the primary method of resolving individual insolvencies.
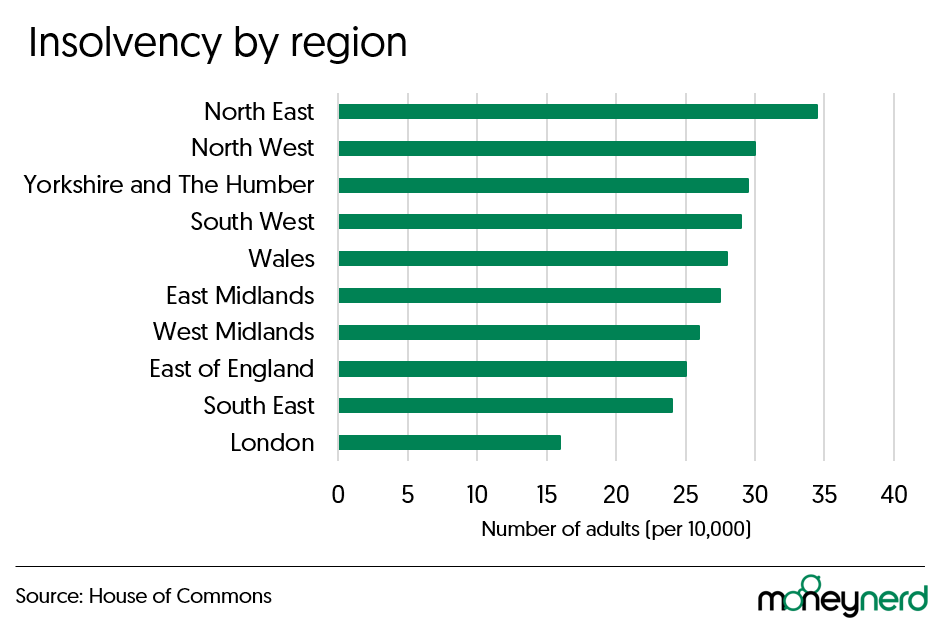
Regional insolvencies in the UK
With 34.6 insolvencies per 10,000 adults, the North East proved to have the highest rate of insolvency in England and Wales.
Since 2008, it has had the highest rate of bankruptcy in the country. It experienced the highest rate of debt relief orders (DROs) and individual voluntary agreements (IVAs), whereas the South West experienced the highest rate of bankruptcy.
London had the lowest insolvency rate and the lowest DRO, IVA, and bankruptcy rates.
The East Midlands experienced the greatest increase in insolvency rates (2.9 per 10,000 individuals), whereas London experienced the smallest increase (0.1 per 10,000 adults). Rate increases were often greater in regions that already had a higher rate in 2018.
In each region, IVAs were the most prevalent type of insolvency. Except in London, where bankruptcies were more prevalent, DROs were the second most common type of insolvency.
London had the highest percentages of bankruptcies and IVAs (related to insolvency type), whereas the North East had the highest percentages of DROs.
Yorkshire and the Humber had the lowest bankruptcy rate, the North East had the lowest IVA rate, and London had the lowest DRO rate.
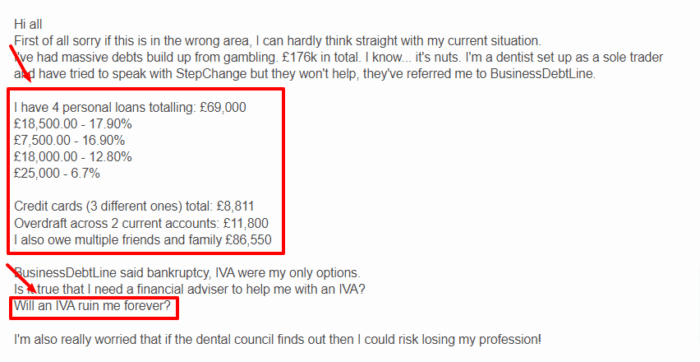
Note that insolvency (e.g. IVA or bankruptcy) will negatively impact your credit rating. This can make it more difficult for them to obtain credit in the future. In addition, your assets might be sold off to pay the debts. Your financial freedom might also be restricted. Lastly, if you work in finance or law, you might get fired or banned from practising due to insolvency.
Thousands have already tackled their debt
Every day our partners, The Debt Advice Service, help people find out whether they can lower their repayments and finally tackle or write off some of their debt.

Natasha
I’d recommend this firm to anyone struggling with debt – my mind has been put to rest, all is getting sorted.
Reviews shown are for The Debt Advice Service.
Understanding Insolvency
The term “insolvency” refers to a situation in which a person is unable to pay their financial commitments to creditors when debts accrue. The commitments can range from bank loans to service debts with internet providers, such as TalkTalk.
When a person becomes insolvent, they have a few options. They can either reach an informal agreement with their creditors, which may relieve some of the pressure, or they can file for formal insolvency, which we’ll examine in these statistics.
In 2021, the rate of individual insolvencies grew from January to April by 3.2% compared to the same period in the previous year.
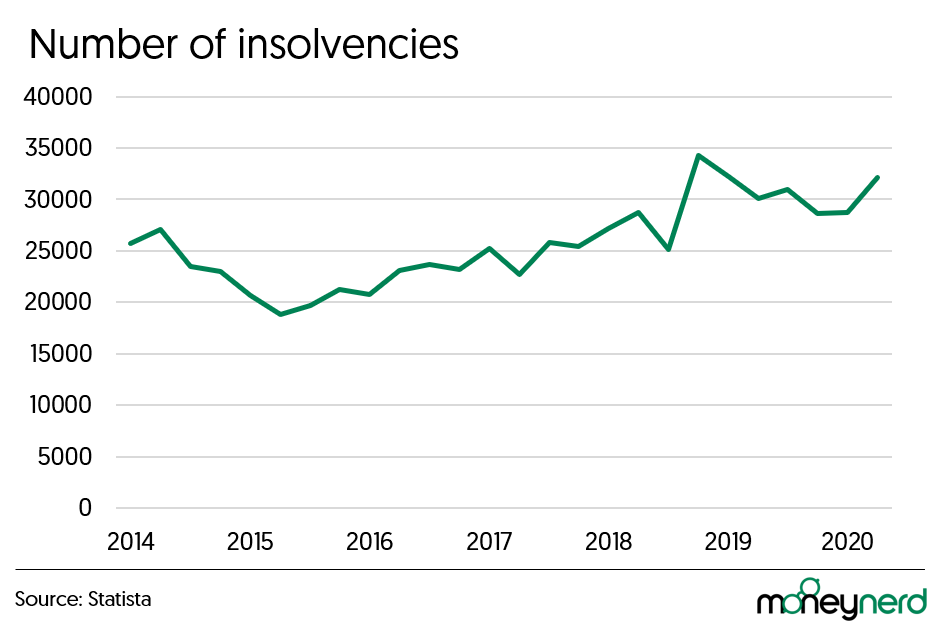
Total number of individual insolvencies in England and Wales from 2014 to 2020
How is Insolvency different from Bankruptcy?
While bankruptcy is a form of insolvency, bankruptcy is usually applied to a person rather than a company.
It is a kind of personal insolvency that is more severe than individual voluntary arrangements (IVAs), debt relief orders, or debt management plans, all of which assume that an individual is able to repay at least some of the money owed.
As a rule, bankruptcy means that creditors have no hope of recouping their losses. Most of the time, it’s a state that the court declares because either the person’s assets aren’t worth enough to cover their debts, or they can’t pay them.
575 bankruptcies were registered in January 2022, which was 32% lower than in January 2021 and 63% lower than January 2020.